
Leveraging multiple cores is essential for accelerating data – intensive tasks like data analysis, machine learning, and numerical simulations. While GPUs offer immense parallel computing power, this post focuses on CPU-based parallelism. There are two main approaches to achieving parallelism: multi-threading and multi-processing. While both approaches divide one big task into smaller and concurrent execution flows, they have fundamental differences that affect performance, memory usage, and application design.
Multi-threading runs multiple threads within the same process, sharing the process’s (heap) memory space. In Python, however, the Global Interpreter Lock (GIL) only allows one thread to run at a time. This means threads within the same Python process cannot run simultaneously on multiple cores. Nevertheless, multi-threaded Python code can leverage multiple cores when using C extensions that release the GIL during execution, such as NumPy or XGBoost.
On the other hand, multi-processing bypasses the GIL by creating separate processes. Each process has its own Python interpreter and memory space, enabling true parallelism on multiple cores. However, since processes do not inherently share memory, transferring data between them can introduce overhead and complexity.
Joblib is a popular Python library that simplifies both approaches. It provides an intuitive interface for robust parallel processing. Yet, as with any parallelization tool, Joblib can encounter challenges, particularly with memory usage.
In this blog post, we’ll explore two memory error scenarios: one specific to Joblib and another more general to Python. We’ll examine their root causes and walk through practical strategies for troubleshooting and resolving them. If you are new to parallel processing in Python, check out these resources to build a basic understanding before diving in:
Memory Error Scenario 1
Let’s consider the following seemingly innocuous code.
import numpy as np
from joblib import Parallel, delayed

# 8 GiB data in main process
data = np.random.rand(2**30) # float64 dtype

def parallel_f(data_slice, i, j):
    pass

# process 160 tasks with 2 worker processes
Parallel(n_jobs=2, backend='multiprocessing')(
    delayed(parallel_f)(
        data[i * 2**27 : (i+1) * 2**27], i, j
    ) for i in range(8) for j in range(20)
)
The main process begins by allocating an 8 GiB NumPy array. It then divides the array into 8 slices and assigns 20 tasks per slice. Two worker processes concurrently execute those tasks. Joblib offers three built-in backends for parallel processing: loky, multiprocessing, and threading.
The default backend is loky which relies on process-based parallelism, as does the multiprocessing backend. This requires transferring data from the main process to the worker processes. At first glance, one might expect the total memory usage to be approximately 10 GiB: 8 GiB for the main process and an additional 1 GiB for a single slice in each of the two worker processes. However, when running the code with these backends, the program crashes with the following error:
OSError: [Errno 28] No space left on device
This error occurs when disk space is full. Interestingly, the machine running this program has over 500 GiB of available disk space.
On the other hand, when the threading backend is used, the program’s total memory usage remains at 8 GiB. This is because all worker threads can access the main process’s heap memory, to which the NumPy array is allocated, and the slices are NumPy views that share the same underlying data buffer as the original array. However, this approach introduces a different issue, which will be revisited in Scenario 2.
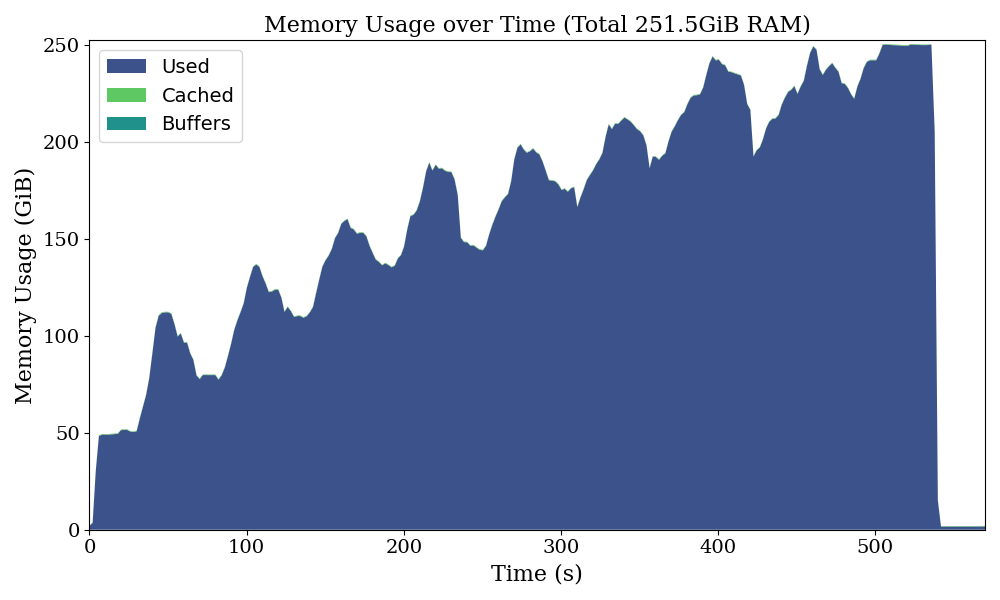
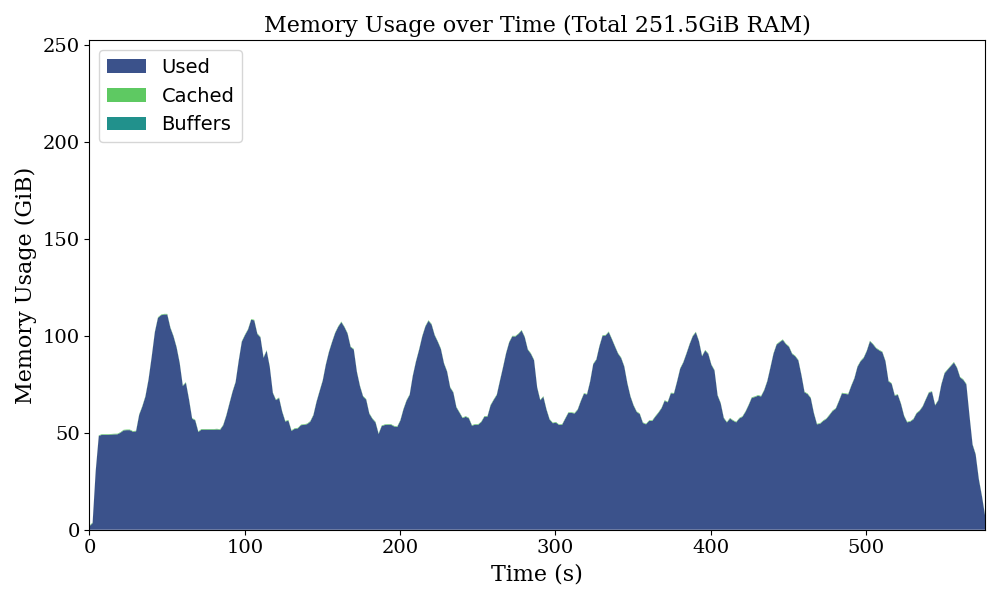
These observations motivate us to investigate the problem and understand the underlying mechanisms. To begin, let’s log and plot the system memory usage and disk usage over time. Both loky and multiprocessing backends exhibit the same memory behavior.
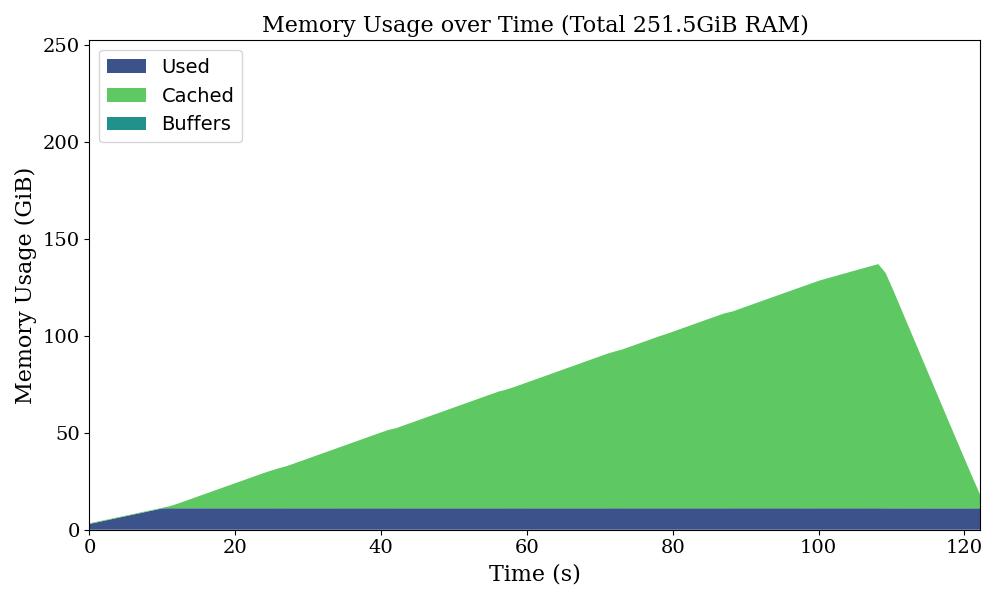
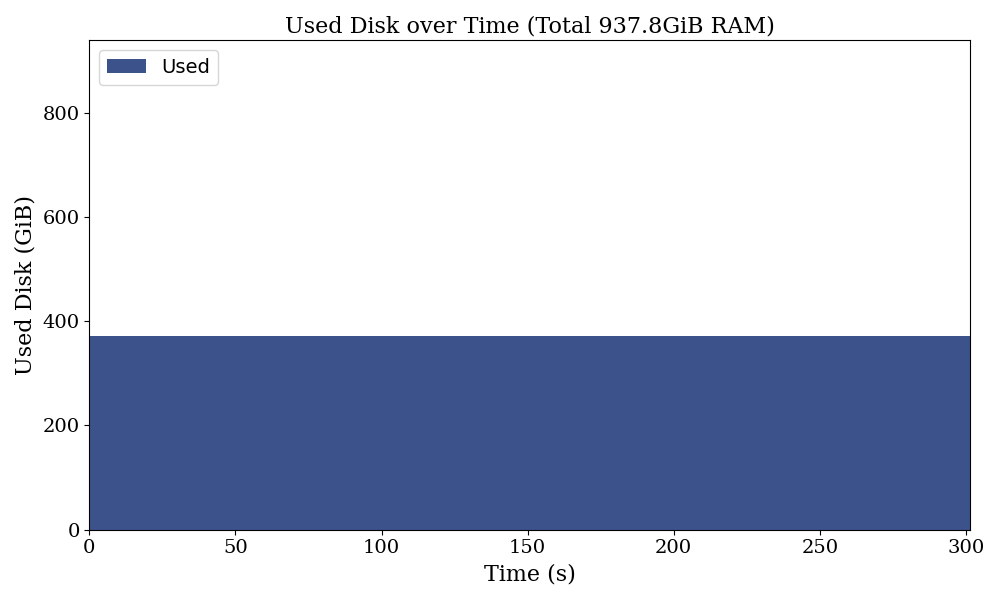
Surprisingly, there is no change in disk usage while the program is running, and despite our system having 252 GiB of available RAM, the program crashes when only around half that amount is occupied. This highlights four key issues:
- High memory consumption: Even for a relatively small dataset, the amount of memory consumed (especially Cached) is unexpectedly large.
- Consistent memory growth: Memory usage increases steadily over time, indicating inefficiencies in data handling.
- Premature crashes: The program crashes even when the system maximum has not been reached.
- No disk usage: Although the error message indicates insufficient disk space, the program does not use any disk space.
Understanding Cache in RAM
In the system memory plot, we observe that the used memory increases first, followed by a steady increase in the cache region. The used memory represents the 8 GiB NumPy array allocated in the main process’s memory space. However, the unusually large growth in the cache region suggests that understanding how it operates is crucial to resolving the issue.
The cache here does not refer to CPU caches like L1 or L2 cache. Instead, it refers to a portion of RAM the operating system uses to cache files from the disk (Page Cache). The primary role of page cache is to optimize disk I/O operations by reducing access times.
Here’s how it works: When a disk I/O request is made, the operating system first checks if the requested data exists in page cache. If it does, the system can access the data directly from RAM, avoiding the slow disk access. If the data isn’t in page cache, the operating system allocates a new page cache and loads the data from the disk into RAM for subsequent use.
Joblib and Memory-Mapped Files
A memory-mapped file is a mechanism that maps a file, or a portion of it, into a process’s virtual address space. This allows the process to access the file’s content as if it were part of its memory, bypassing standard file I/O operations that involve system calls. Multiple processes can share the same memory-mapped file by mapping their virtual address space to the same page cache where the file is loaded.
According to the Joblib documentation, when a large NumPy array is passed to a worker process, Joblib automatically creates a binary file of the array and passes a numpy.memmap object that accesses the file in a memory-mapped manner to the worker process. If the same array is passed to another task, Joblib reuses the existing binary file to avoid redundant copies. Furthermore, if the file is already in the page cache, disk I/O is avoided entirely. Joblib retains these files throughout parallel execution, enabling efficient data sharing across multiple tasks.
In our example, the intended workflow is to create a single copy of the binary file for the 8 GiB NumPy array. This file should be shared among all worker processes across tasks, eliminating the overhead associated with duplicating the data for each process.
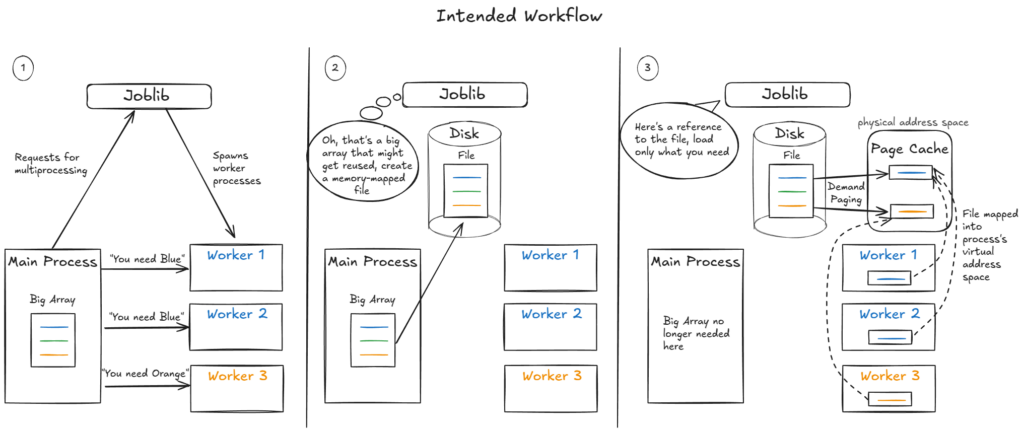
Note: For simplicity, the above figure depicts the main process directly writing a file on disk (2). In reality, the file is written to page cache in RAM and then asynchronously to disk. This page cache remains in RAM indefinitely unless the system experiences memory pressure. As long as the requested portions of the file remain in the page cache, worker processes can access them directly from RAM, avoiding additional disk I/O overhead.
However, inspecting files opened by worker processes reveals unintended behavior.
data = np.random.rand(2**30)

def parallel_f(data_slice, i, j):
    print(f"i: {i}, j: {j}, pid: {os.getpid()}, " +
          f"open_files: {psutil.Process().open_files()}")

Parallel(n_jobs=2, backend='multiprocessing')(
    delayed(parallel_f)(
        data[i * 2**27 : (i+1) * 2**27], i, j
    ) for i in range(8) for j in range(20)
)
Output
i: 0, j: 0, pid: 852172, open_files: [popenfile(path='/dev/shm/joblib_memmapping_folder_852130_194b8a3136994b3082542cdf5d6daa0c_13984e93a11a475c858ffe5b42cbbcd8/852130-139920413629296-983eb12e96e540d8ac31c82675f7d801.pkl', fd=13, position=1073742065, mode='r', flags=557056)]2eb6782f722343f9af4f0c923029f351
i: 0, j: 1, pid: 852173, open_files: [popenfile(path='/dev/shm/joblib_memmapping_folder_852130_194b8a3136994b3082542cdf5d6daa0c_13984e93a11a475c858ffe5b42cbbcd8/852130-139920413629296-.pkl', fd=15, position=1073742065, mode='r', flags=557056)]d48c991f64ed4c89a444d5a9079e1131
i: 0, j: 2, pid: 852172, open_files: [popenfile(path='/dev/shm/joblib_memmapping_folder_852130_194b8a3136994b3082542cdf5d6daa0c_13984e93a11a475c858ffe5b42cbbcd8/852130-139920413629296-.pkl', fd=13, position=1073742065, mode='r', flags=557056)]...
Joblib reuses two worker processes across all tasks as intended, but each task opens a different binary file, even though each one is using the same data slice. As a result, each binary file ends up being used only once rather than being efficiently shared across tasks. Since those files are retained throughout the parallel execution, a steady increase in page cache usage is observed over time. Given that the loop over j iterates 20 times over the entire array, the program requires 160 GiB to create all the files. This explains 1) high memory consumption and 2) consistent memory growth.
Nevertheless, our system has 252 GiB of RAM and over 500 GiB of available disk space. Why does it crash? Let’s look closer at /dev/shm where the binary files are stored.
$ df -h /dev/shm
Filesystem      Size  Used Avail Use% Mounted on
tmpfs           126G     0  126G   0% /dev/shm
/dev/shm is a temporary file system that stores files in RAM instead of disk. This explains why 4) there is no disk usage by this program yet we get what looks like an out-of-memory error message on the device. Finally, we see that the system’s /dev/shm is configured with a capacity of 126 GiB, explaining 3) premature crashes: creating a new file in /dev/shm fails once its maximum capacity of 126 GiB is reached, despite there being plenty of RAM and disk space.
Digging into Joblib’s Source Code
The reason for this undesirable behavior can be found in Joblib’s source code. When a large NumPy array is passed to a worker process, Joblib creates a binary file of the array and manages a keymap to map the array’s Python object ID to the file. When the same object is passed again, the file is reused. However, each data slice in our example creates a new Python object, even if it’s a view of the original array. Joblib treats these as distinct Python objects and consequently creates a new binary file for each slice.
Solution to Scenario 1
Now that we’ve identified the root cause of the memory issue, the solution is quite simple: ensure that the same objects are passed to Joblib.
data = np.random.rand(2**30)
def parallel_f(slice_memmap, i, j):
pass
data_slices = [data[i * 2**27 : (i+1) * 2**27] for i in range(8)]
Parallel(n_jobs=2, backend='multiprocessing')(
delayed(parallel_f)(
data_slices[i], i, j
) for i in range(8) for j in range(20)
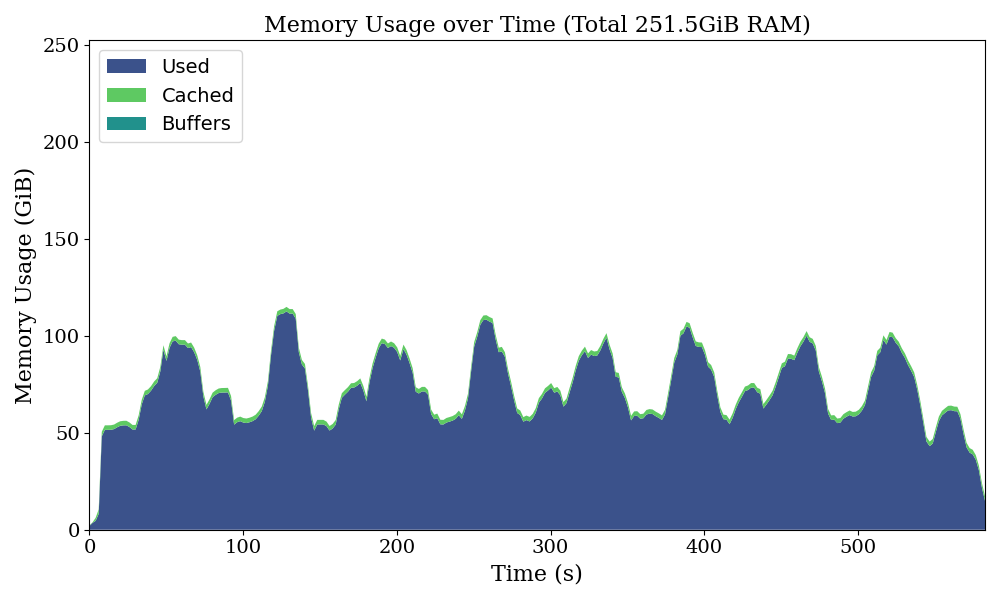
)This solution creates eight binary files, one for each slice, effectively shared across the loop over j.
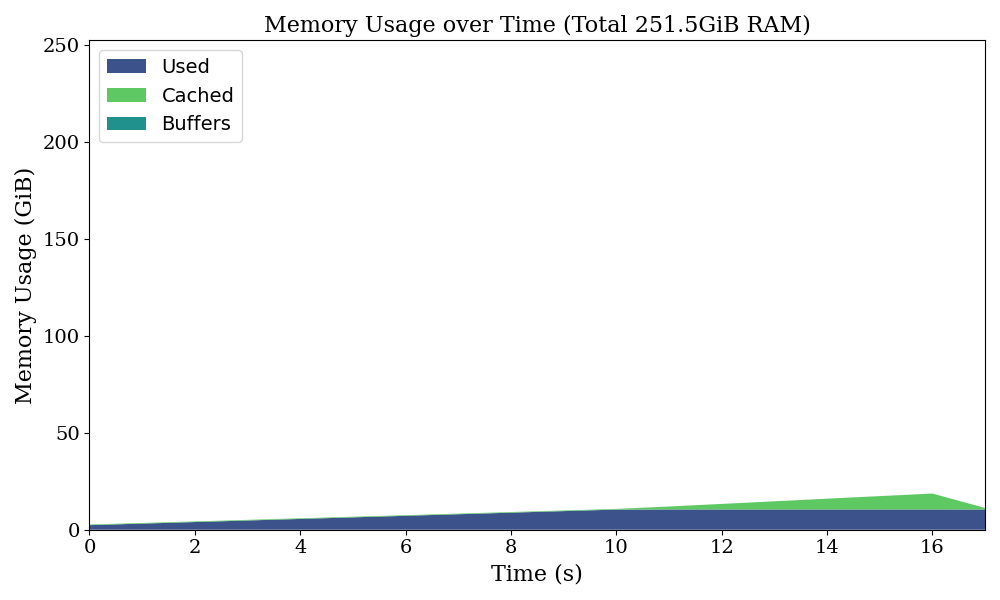
As intended, page cache now uses about 8 GiB of memory. This also significantly reduces the program’s wall clock time, as redundant copies of the binary files are not created.
Alternatively, we can pass the entire array to Joblib as a single object. This approach creates a single binary file for the whole array. Since numpy.memmap supports slicing just like a standard NumPy array, we can make smaller views of numpy.memmap that access the same underlying file.
data = np.random.rand(2**30)

def parallel_f(data_memmap, i, j):
    slice_memmap = data_memmap[i * 2**27 : (i+1) * 2**27]

Parallel(n_jobs=2, backend='multiprocessing')(
    delayed(parallel_f)(
        data, i, j
    ) for i in range(8) for j in range(20)
)
A slightly more efficient solution is explicitly creating a binary file of the array in advance and passing numpy.memmap that references the file. This approach is beneficial when the main process doesn’t need to retain the data in memory. In the above solutions, the data is held in the main process to merely use its object ID as a key for its associated binary file managed by Joblib. By explicitly managing memory mapping, we can delete the data from the main process after creating a binary file of the data.
from joblib import Parallel, delayed, dump, load

try:
    data = np.random.rand(2**30)
    temp_folder = tempfile.mkdtemp(dir="/dev/shm")
    file_path = os.path.join(temp_folder, "data.mmap")
    dump(data, file_path)
    del data
    data_memmap = load(file_path, mmap_mode='r')

    def parallel_f(data_memmap, i, j):
        slice_memmap = data_memmap[i * 2**27 : (i+1) * 2**27]

    Parallel(n_jobs=2, backend='multiprocessing')(
        delayed(parallel_f)(
            data_memmap, i, j
        ) for i in range(8) for j in range(20)
    )
finally:
    shutil.rmtree(temp_folder, ignore_errors=False)
Disk vs RAM Disk
Before proceeding, let’s examine disk I/O behavior more closely. As previously mentioned, when data is written to a file on disk, it is first written to page cache and then asynchronously written to disk. If the system encounters memory pressure, the page cache can be freed. Subsequent disk I/O operations on that file will have to reload the required data back into page cache if it is no longer cached in RAM.
To demonstrate this behavior, let’s create and access a memory-mapped file and observe page cache usage.
import os
import time
import tempfile
import numpy as np
from psutil import virtual_memory

data = np.random.rand(2**30)
data_dtype, data_shape = data.dtype, data.shape
temp_folder = tempfile.mkdtemp(dir=os.environ.get("HOME"))
file_path = os.path.join(temp_folder, 'data.mmap')
data_memmap = np.memmap(file_path, dtype=data_dtype, mode='w+', shape=data_shape)
print(f"Create memmap: {virtual_memory().cached>>20} MiB cached")

data_memmap[:] = data[:]
print(f"Write to memmap: {virtual_memory().cached>>20} MiB cached")

# drop clean caches
# refer drop_caches in https://www.kernel.org/doc/Documentation/sysctl/vm.txt
data_memmap.flush()
del data_memmap
os.system("sync")
os.system("sudo sh -c 'echo 3 >/proc/sys/vm/drop_caches'")
print(f"Drop cache: {virtual_memory().cached>>20} MiB cached")

data_memmap = np.memmap(file_path, dtype=data_dtype, mode='r', shape=data_shape)
print(f"Recreate memmap: {virtual_memory().cached>>20} MiB cached")

start_time = time.time()
new_array = data_memmap[:2**29] + 1
end_time = time.time()
assert np.array_equal(new_array, data[:2**29] + 1)
print(f"Read memmap: {virtual_memory().cached>>20} MiB cached")
print(f"    Read memmap time: {end_time - start_time:.2f} seconds")
print(f"    type(data_memmap): {type(data_memmap)}")
print(f"    type(new_array): {type(new_array)}")
Output
Create memmap: 471 MiB cached
Write to memmap: 8886 MiB cached
Drop cache: 413 MiB cached
Recreate memmap: 413 MiB cached
Read memmap: 4513 MiB cached
\(\quad\)Read memmap time: 10.99 seconds\(\quad\)type(data_memmap): <class 'numpy.memmap'>\(\quad\)type(new_array): <class 'numpy.ndarray'>
- Initial Write: When the file is created, nothing is cached. When an 8 GiB NumPy array is written, it is first written to page cache before being flushed to disk asynchronously.
- Dropping Cache: We can simulate memory pressure by forcing the system to drop page cache, freeing the 8 GiB previously allocated.
- Reloading Data: By reading half of the memory-mapped file, 4 GiB of data is loaded back into page cache. Since the data must now be read from the disk, this operation is significantly slower than accessing data directly from RAM.
Let’s rerun the code, but this time, create the file on RAM disk at /dev/shm.
Output
Create memmap: 314 MiB cached\(\quad\)
Write to memmap: 8505 MiB cached
Drop cache: 8495 MiB cached
Recreate memmap: 8495 MiB cached
Read memmap: 8496 MiB cachedRead memmap time: 3.83 seconds
\(\quad\)type(data_memmap): <class 'numpy.memmap'>\(\quad\)type(new_array): <class 'numpy.ndarray'>
When a file is written to RAM disk, it is written to page cache but not to the physical disk. Since there is no backup of the cached data on the physical disk, the page cache will not be freed by the OS even under system memory pressure (though it can be swapped to disk if swap space is used). The read operation is significantly faster than before, as the data is accessed directly from RAM instead of the physical disk.
This experiment highlights how page cache optimizes disk I/O and how system memory pressure can impact performance when data needs to be reloaded from disk.
A Common Mistake with Multi-Processing
Beyond Joblib-specific issues, memory inefficiencies can result from a common mistake in passing an instance method to worker processes.
from joblib import Parallel, delayed

class ParallelEngine:
    def __init__(self, large_object):
        self.attribute = large_object

    def parallel_f(self, data, i):
        pass

    def run(self, data):
        Parallel(n_jobs=-1, backend='multiprocessing')(
            delayed(self.parallel_f)(
                data, i
            ) for i in range(100)
        )
Submitting an instance method to multi-processing as self.parallel_f results in the entire self object, including all its attributes, being copied to every worker process. If the self object contains large attributes, this leads to unintended memory consumption and increases the time required for serialization.
Memory Error Scenario 2
Let’s consider another example.
data = np.random.rand(2**27, 1)
label = np.random.rand(2**27, 1)

def parallel_f(data, label, i):
    new_data = data * i
    xgb.QuantileDMatrix(new_data, label, nthread=1)

Parallel(n_jobs=30, backend='threading')(
    delayed(parallel_f)(
        data, label, i
    ) for i in range(300)
)
XGBoost releases the GIL while executing its C++ engine, making multi-threading a compelling choice for parallel processing. Unlike processes, threads share the same memory space, in particular, the heap memory. All Python objects and dynamically allocated memory in C extensions are stored in the process’s heap memory space, and hence, worker threads can access those without explicitly handling data transfer.
In this example, the data and label arrays are allocated in the main process, each consuming 1 GiB of memory. References to these objects are passed to 30 worker threads, which each create a copy of data (named new_data), collectively consuming 30 GiB of process memory. Moreover, constructing QuantileDMatrix consumes extra memory, roughly similar to the combined size of the input data and label (2 GiB). In total, the 30 worker threads should simultaneously consume approximately 90 GiB of memory.
Despite having enough memory in our system, this program crashes with the following error:
Killed
Diagnosis Scenario 2
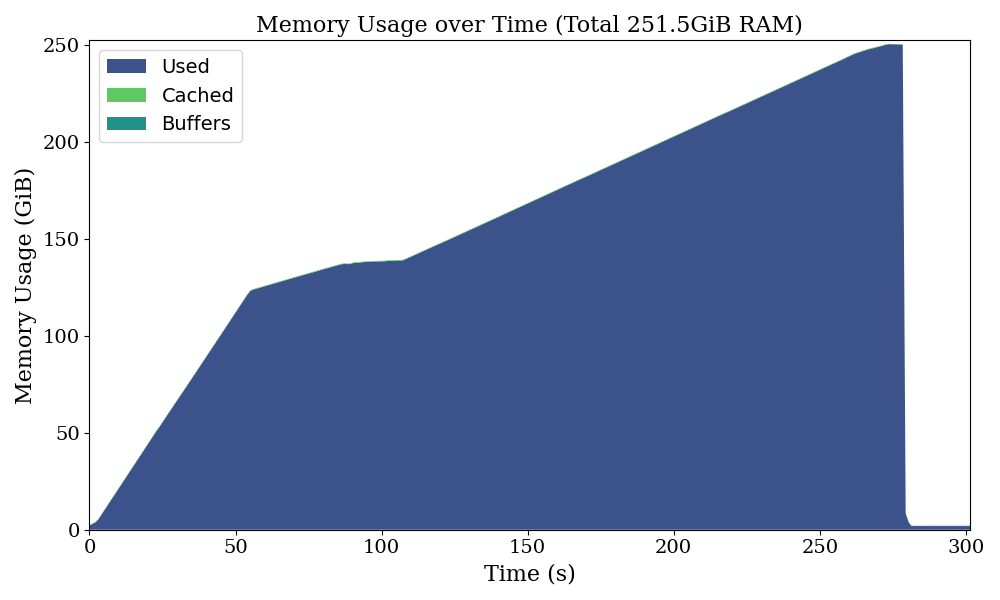
Let’s start by plotting the system memory usage over time.
Running this program with the loky backend instead gives a different result:
It seems something went wrong with multi-threading, but running this with the multiprocessing backend in Joblib causes the program to hang indefinitely (this suggests a potential deadlock with multi-processing, but I don’t have concrete evidence to confirm this):
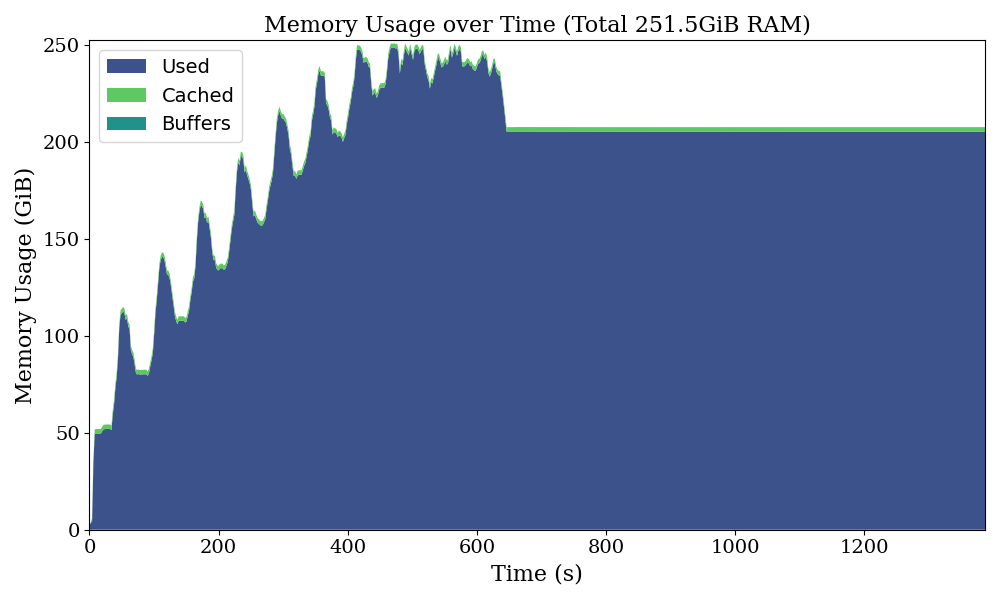
This indicates there is something special with the loky backend.
In addition, this issue only occurs when using QuantileDMatrix but not with DMatrix. Upon investigating the XGBoost source code, I discovered that QuantileDMatrix creates a circular reference during its construction, which is the root cause of our issues.
Circular References and Garbage Collection
CPython manages object memory primarily through reference counting. Each Python object has an associated reference count that tracks how many references point to it. When an object’s reference count drops to zero, its memory is deallocated immediately. However, circular references, where two or more objects reference each other or an object references itself, prevent the reference count from reaching zero. This leads to memory remaining allocated unnecessarily. To address circular references, CPython has a Garbage Collector (GC) that runs periodically based on heuristics. The GC can also be triggered manually using gc.collect().
The following code demonstrates reference counting behavior on DMatrix and QuantileDMatrix:
import numpy as np
import xgboost as xgb
import gc
import ctypes

def ref_count(obj_id):
    return ctypes.c_long.from_address(obj_id).value

data = np.random.rand(2**10, 1)
label = np.random.rand(2**10, 1)
print("Initial ref count:", ref_count(id(data)), ref_count(id(label)))
xgb.DMatrix(data, label)
print("Ref count after DMatrix construction:", ref_count(id(data)), ref_count(id(label)))
print()

data_q = np.random.rand(2**10, 1)
label_q = np.random.rand(2**10, 1)
print("Initial ref count:", ref_count(id(data_q)), ref_count(id(label_q)))
xgb.QuantileDMatrix(data_q, label_q)
print("Ref count after QuantileDMatrix construction:", ref_count(id(data_q)), ref_count(id(label_q)))
gc.collect()
print("Ref count after gc.collect():",ref_count(id(data_q)), ref_count(id(label_q)))
Output
Initial ref count: 1 1
Ref count after DMatrix construction: 1 1

Initial ref count: 1 1
Ref count after QuantileDMatrix construction: 2 2
Ref count after gc.collect(): 1 1
- After constructing a
DMatrix, the reference counts of the inputdataandlabelremain unchanged. - After constructing a
QuantileDMatrix, the reference counts of the input objects increase by one due to an internal circular reference. - Calling
gc.collect()explicitly removes the circular reference, restoring the reference counts to their original values.
To demonstrate that circular references can cause memory issues, consider the following simplified example:
class Circular():
    def __init__(self, data):
        self.circular = self
        self.data = data

data = np.random.rand(2**28, 1)

for i in range(300):
    new_data = data * i
    Circular(new_data)
This results in the same error as before: Killed
In this example, the Circular class deliberately creates a self-referencing structure (self.circular = self), causing a circular reference. This circular reference prevents the object’s reference count from reaching zero without the GC’s intervention. Consequently, the reference count of its attribute data also never reaches zero without the GC.
As a result, the copies of data created by each iteration stay in memory indefinitely until the GC is triggered to resolve the circular references. If the GC is not triggered before all available memory (RAM + swap space) is consumed, the program will eventually crash due to an out-of-memory error.
Solution to Scenario 2
Now that we understand the problem, the solution is straightforward: trigger GC at the end of each task to clean up circular references.
def parallel_f(data, label, i):
    new_data = data * i
    xgb.QuantileDMatrix(new_data, label, nthread=1)
    gc.collect()
This modification resolves the memory issue for both threading and multiprocessing backends.
Notably, this solution has already been implemented for us in Joblib’s loky backend. The loky backend explicitly calls gc.collect() after completing each task, ensuring memory is cleaned up.
However, triggering GC excessively has downsides: 1) running GC introduces additional computational overhead, and 2) GC must run with the GIL acquired to prevent race conditions on reference counting, which can degrade performance, especially with multi-threading.
Of course, the ideal solution would be to avoid creating circular references in the first place (in this case, I submitted a pull request to remove the circular reference in XGBoost). However, if that’s not an option, weakref can be used to prevent circular references since it does not increase the reference count.
Miscellaneous: Copy-on-Write in Python
In UNIX-like systems, forked child processes inherit the parent process’s memory. This memory is only copied when child processes modify memory regions; this mechanism is known as Copy-on-Write (CoW). This makes multi-processing efficient when child processes only read data created by the parent process, as the data can effectively be shared without duplication.
However, CoW has limitations in Python. Reference counting and GC modify objects’ memory regions, even for read-only operations, making CoW suboptimal. You can learn more about this from the following blog posts: Python vs Copy on Write and Copy-on-write friendly Python garbage collection. Instagram also introduced “immortal objects” to CPython, starting in version 3.12. Immortal objects remain unaffected by reference count updates throughout the program’s lifetime, enabling better compatibility with CoW. You can read more about this in Introducing Immortal Objects for Python.
Another potential issue with forked processes is the risk of deadlocks. This occurs because the forked process inherits the memory state of the parent, including locks that may lead to inconsistencies. For more details, refer to Why your multiprocessing Pool is stuck (it’s full of sharks!). To mitigate this risk, Joblib’s loky backend creates child processes using the spawn method. Unlike fork, which inherits the parent’s memory state, spawn ensures that each child process starts with fresh memory space. However, while spawn improves stability, it is generally slower and uses more memory than fork. Additionally, efforts are underway to remove the GIL from CPython, aiming to achieve better concurrency.
Closing Thoughts
Effective memory management is fundamental to building efficient and scalable applications, especially in data-intensive domains. As we’ve explored, understanding Python’s memory management and the internal workings of libraries like Joblib and XGBoost is essential for identifying and addressing memory-related challenges.
These challenges are particularly pronounced in high-performance machine learning workflows. Training complex models often requires handling large datasets, performing computationally intensive tasks, and leveraging parallel processing. Together, these factors significantly increase memory consumption, making it vital to adopt efficient memory management practices.
We first encountered these memory issues while training XGBoost ensembles for large-scale generative modelling tasks. This experience led us to explore solutions for optimizing memory usage, balancing performance, and ensuring program stability. For a detailed case study and practical strategies for overcoming these challenges, refer to our paper, Scaling Up Diffusion and Flow-based XGBoost Models.